- /
- Librarie online
- /
- Carti in engleza
- /
- Juvenile Nonfiction
- /
- Science & Nature
- /
- General
- /
- Natural Disasters Through Infographics - Nadia Higgins
Natural Disasters Through Infographics
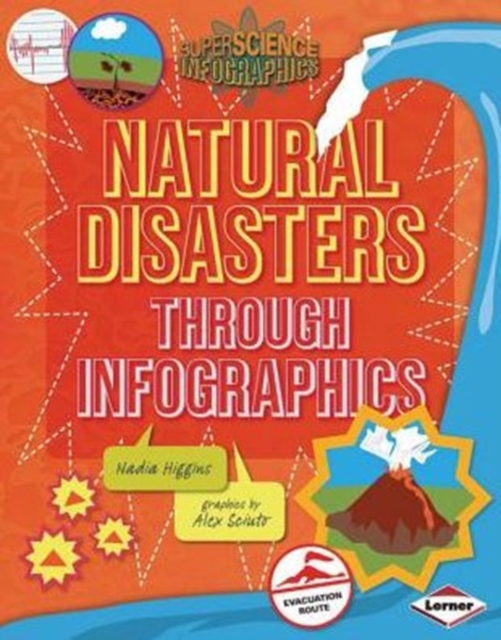
The facts about natural disasters are so big and devastating they could make your head explode You hear about huge costs (like the $360,000,000,000 in damage caused by the 2011 tsunami in Japan), huge speeds (the fastest-moving tsunami waves have been recorded at 500 miles per hour), and even huger mysteries (where, exactly, the danger zones are for natural disasters).
How can all these big numbers and concepts make more sense? Infographics The charts, maps, and illustrations in this book tell a visual story to help you better understand key concepts about natural disasters. Crack open this book to explore mind-boggling questions such as:
- How can scientists accurately predict natural disasters?
- What were some of Earth's biggest, freakiest, and deadliest disasters?
- How can you protect yourself in the event of a volcano, an earthquake, or a tsunami?
The answers are sure to shake you up
PRP: 55.74 Lei

Acesta este Prețul Recomandat de Producător. Prețul de vânzare al produsului este afișat mai jos.
50.17Lei
50.17Lei
55.74 LeiPrimești 50 puncte

Livrare in 2-4 saptamani
Descrierea produsului
The facts about natural disasters are so big and devastating they could make your head explode You hear about huge costs (like the $360,000,000,000 in damage caused by the 2011 tsunami in Japan), huge speeds (the fastest-moving tsunami waves have been recorded at 500 miles per hour), and even huger mysteries (where, exactly, the danger zones are for natural disasters).
How can all these big numbers and concepts make more sense? Infographics The charts, maps, and illustrations in this book tell a visual story to help you better understand key concepts about natural disasters. Crack open this book to explore mind-boggling questions such as:
- How can scientists accurately predict natural disasters?
- What were some of Earth's biggest, freakiest, and deadliest disasters?
- How can you protect yourself in the event of a volcano, an earthquake, or a tsunami?
The answers are sure to shake you up
Detaliile produsului