Graphics Cookbook 2e
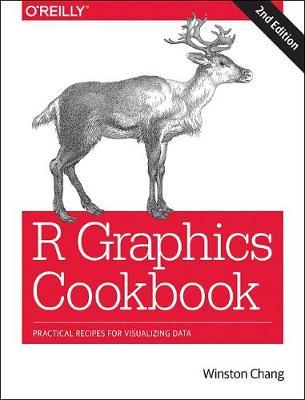
Graphics Cookbook 2e
This O'Reilly cookbook provides more than 150 recipes to help scientists, engineers, programmers, and data analysts generate high-quality graphs quickly--without having to comb through all the details of R's graphing systems. Each recipe tackles a specific problem with a solution you can apply to your own project and includes a discussion of how and why the recipe works.
Most of the recipes in this second edition use the updated version of the ggplot2 package, a powerful and flexible way to make graphs in R. You'll also find expanded content about the visual design of graphics. If you have at least a basic understanding of the R language, you're ready to get started with this easy-to-use reference.
- Use R's default graphics for quick exploration of data
- Create a variety of bar graphs, line graphs, and scatter plots
- Summarize data distributions with histograms, density curves, box plots, and more
- Provide annotations to help viewers interpret data
- Control the overall appearance of graphics
- Explore options for using colors in plots
- Create network graphs, heat maps, and 3D scatter plots
- Get your data into shape using packages from the tidyverse
PRP: 702.58 Lei
Acesta este Pretul Recomandat de Producator. Pretul de vanzare al produsului este afisat mai jos.
597.19Lei
597.19Lei
702.58 LeiLivrare in 2-4 saptamani
Descrierea produsului
This O'Reilly cookbook provides more than 150 recipes to help scientists, engineers, programmers, and data analysts generate high-quality graphs quickly--without having to comb through all the details of R's graphing systems. Each recipe tackles a specific problem with a solution you can apply to your own project and includes a discussion of how and why the recipe works.
Most of the recipes in this second edition use the updated version of the ggplot2 package, a powerful and flexible way to make graphs in R. You'll also find expanded content about the visual design of graphics. If you have at least a basic understanding of the R language, you're ready to get started with this easy-to-use reference.
- Use R's default graphics for quick exploration of data
- Create a variety of bar graphs, line graphs, and scatter plots
- Summarize data distributions with histograms, density curves, box plots, and more
- Provide annotations to help viewers interpret data
- Control the overall appearance of graphics
- Explore options for using colors in plots
- Create network graphs, heat maps, and 3D scatter plots
- Get your data into shape using packages from the tidyverse
Detaliile produsului


